Level Based metrics is a Column whose values always measured at a particular level of Aggregation.
Example:
For example, a company might want to measure its revenue based on the country, based on the region, and based on the city. You can set up columns to measure CountryRevenue, RegionRevenue, and CityRevenue.
Try to Understand the simple Example.

Basically, we have a hierarchy and we would like to have the Sales measure aggregated over 3 levels i.e. Total Level, Region Level and the Country level. Now lets start with creating 3 logical measure columns Sales By Region, Sales By Country and Total Sales. Easch of these measures are exact replica of the Sales Measure which has a default aggregation of SUM.

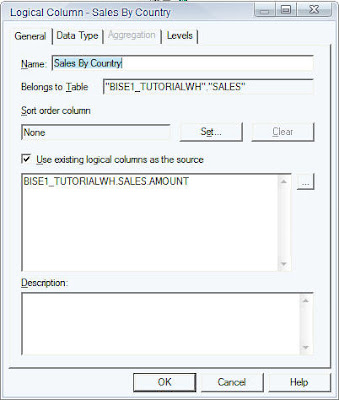

Now, in order to make the 3 columns to aggregate over Region, Country and Total levels just drag and drop the corresponding columns to their associated levels as shown below.

Now, try creating a report with all the 4 columns(including the base SUM aggregated Sales measure) and see what happens.

As shown above what happens is Sales By Country calculates the sales across all the countries. Sales By Region calculates the sales across all the regions. And Total sales gives total sales across all the regions and countries. But you would see a lot of line items because of the granularity at which the Sales By Country Works. Since there are 17 different countries you would see 17 different line item sums. Now, if you remove the Sales By Country column the number of line items gets reduced to the number of regions i.e. 5

I hope this could be helpful for Level Based Measeure (LBM)
Yes good comobination and you can learn the Bi-Apps.
ReplyDeletenice post.I found something new can get useful info about BEST obiee ONLINE TRAINING
ReplyDelete