Saturday, December 31, 2011

OBIEE External Table Authenticaion

Steps for Creating External Table Authencticaion


1) First create a table with username, password, and group_name


Open your rpd
  1. Select Manage > Variables to open the Variable Manager.
  1. Select Initialization Blocks on the left tree pane.
  1. Right-click on white space in the right pane, and then click on New Initialization Block from the right-click menu.
  1. In the Initialization Block dialog box, type the name for the initialization block.
  1. Select Database from the Data Source Connection drop-down list.
  1. Click Browse to search for the name of the connection pool this block will use. 

Fig (2): Initialization block SQLIn the Initialization String area, type the SQL statement that will be issued at authentication time

Create a USER System session variable, Right click on white space in the right pane
  
                                           
Creating a System Session variable

Assign the USER session variable to Authentication Initialization block


OBIEE Data Level and Object Level Security


Data/Object/Column Level Security in OBIEE

Authorization can be done in two ways 

Object level Security :In this we can restrict dashboards, pages, sections, tables
Data level Security:
 Here we can restrict access to values in columns. 
Column level Security: Giving access to certain columns in a table. 

Here we are having three users’ duser1, vuser1.
Groups for which the users belong to-
duser1 - DISNEY
vuser1 - VERIZON
These groups are created in repository under Manage->Security->Groups
Object & Data level security for Disney group:
When duser1 logs in and he belongs to DISNEY group who can view only Financial Dashboard (Object level security) and data in the column, based on the access given to him (Data level security). He can view only few clients (Brand 1).Restricting data in Client column.

Object level security
1) Dashboard/Page/Section level security
Create these groups in Answers.
Admin->Manage Presentation Catalog Groups and Users->Create new catalog group
Give permissions to dashboards for each group as per requirement. (Object level)
Restricting the groups to a dashboard
Settings-->Administration-->Manage Interactive Dashboards-->Click on Dashboard permissions
After clicking on permissions tab then assign the respective group to your dashboard 


When a duser1 logs in he will see only Financial dashboard 


Column level security:
In the presentation layer of repository we need to restrict tables and columns for those groups

Double click on the table->Permissions tab->General
Check show all user/groups and change check box read to tick or cross mark. Now the users under that group cannot view that table in answers.


We have a subject area called Sample Sales Reduced. In this we restricted Other
Dimensions table. When duser1 logs in, he cannot see table from presentation
view/answers. In the below picture we can see Other Dimensions table in
Presentation Layer of repository but its not present in Answers
In the same way i restricted particular column in a table to this
user. Here we restricted No of customers,employees, orders these three columns from
Facts other table for this users. When the user logins he cannot view those columns, but i can see these columns in repository.
In the below picture we can see Facts Others with different columns in Answers and Repository


Thursday, December 29, 2011

OBIEE KPI'S


KPIs are:
• Metrics to measure the performance of an organization relative to its strategic objectives.

KPIs are measurements that define and track specific business goals and objectives that often roll up into larger organizational strategies that require monitoring, improvement, and evaluation.

KPIs have measurable values that usually vary with time, have targets to determine a score and performance status, include dimensions to allow for more specific analysis, and can be compared over time for trending purposes and to identify performance patterns.


KPI status is determined by comparing its actual value against its named ranges that you
define. The performance status of a KPI is represented throughout the system using a
provided or custom status symbol that you assign to each range. In this example five ranges
are defined for a product sales KPI in which high values (those exceeding 125) are desirable.
  • • x< = 50: Values less than or equal to 50 indicate critical performance.
  • • 50 < x <= 80: Values greater than 50 but less than or equal to 80 indicate a warning of poor performance.
  • • 80 < x <= 100: Values greater than 80 but less than or equal to 100 indicate acceptable performance.
  • • 100 < x < =125: Values greater than 100 but less than or equal to 125 indicate good performance.
  • • x > 125: Values exceeding 125 indicate ideal performance.
1.Creating a KPI:  Home-->Click on New -->KPI-->Select the Subject Area

2.Define General Properties 
Use the General Properties pane to assign the business owner responsible for the KPI,
include actual and target values for the KPI, and allow trending.

3. Enable Trending
Select the Enable trending option to compare KPIs for prior periods and to indicate an
increase or decrease in performance.


4. Tolerance
The tolerance can be entered as a percent or as an actual number that represents a difference (change) from the prior period. To represent the tolerance as a percentage, select % from the drop-down list.
Click Next to get Dimensionality pane

5.Dimensionality :
 Dimensionality pane to aggregate KPI values, target values, and ranges, using dimensions in the subject area

Monday, December 26, 2011

Difference Between OBIEE10g and OBIEE 11g

OBIEE 11g:


  1. OBIEE 11g uses WebLogic Server as the application server as compared to Oracle AS or OC4J in OBIEE 10g.
  2. The clustering process in much easier and automated in OBIEE 11g.
  3. We can now model lookup tables in the repository.
  4. The new UI called Unified Framework now combines Answers, Dashboards, and Delivers.
  5. A new column called the hierarchical column in introduced.
  6. BI Publishers is fully and seamlessly integrated with OBIEE 11g.
  7. New time series functions Period Rolling and AGGREGATE AT are introduced.
  8. In OBIEE 11g we can create KPIs to represent business metrics.
  9. The aggregate persistence wizard creates indexes automatically.
  10. The session variables get initialized when they are actually used in OBIEE 11g unlike OBIEE 10g where they were initialized as soon as a user logs in.
  11. OBIEE 11g now supports Ragged (Unbalanced) and Skipped Hierarchy.
  12. You can also define Parent-Child hierarchy in OBIEE 11g as well.
  13. SELECT_PHYSICAL command is supported in OBIEE 11g.

Thursday, December 15, 2011

Project LifeCycle of OBIEE

Project Life  Description For OBIEE Report Developer On OBIEE


As an OBIEE Developer, not everyone work during the whole life cycle of the project. This is especially true for contractors. Considering the RUP there are four life cycle phases of a project- inception, elaboration, construction, and transition. As an OBIEE developer you will be mostly working during the designing, developing, testing, and implementing phase. Sometimes there is involvement in requirements gathering phase but more chances are to work in the refining the requirements.

After explaining this you can tell about the project life cycle as below:

1.  The initiation/inception phase: Creating business case, Project planning and feasibility study.
2.  The elaboration/planning phase: Resource Planning, Requirements gathering and analysis
3. The execution/development phase: Design and development. This is where as an OBIEE developer I worked the most.
4.  The transition/closure phase: Deployment, operations and maintenance.

Thursday, December 8, 2011

OBIEE Level Based Metrics.(LBM)

Level Based metrics is a Column whose values always measured at a particular level of Aggregation.

Example:
For example, a company might want to measure its revenue based on the country, based on the region, and based on the city. You can set up columns to measure CountryRevenue, RegionRevenue, and CityRevenue. 

Try to Understand the simple Example.


Basically, we have a hierarchy and we would like to have the Sales measure aggregated over 3 levels i.e. Total Level, Region Level and the Country level. Now lets start with creating 3 logical measure columns Sales By Region, Sales By Country and Total Sales. Easch of these measures are exact replica of the Sales Measure which has a default aggregation of SUM.


Now, in order to make the 3 columns to aggregate over Region, Country and Total levels just drag and drop the corresponding columns to their associated levels as shown below.


Now, try creating a report with all the 4 columns(including the base SUM aggregated Sales measure) and see what happens.


As shown above what happens is Sales By Country calculates the sales across all the countries. Sales By Region calculates the sales across all the regions. And Total sales gives total sales across all the regions and countries. But you would see a lot of line items because of the granularity at which the Sales By Country Works. Since there are 17 different countries you would see 17 different line item sums. Now, if you remove the Sales By Country column the number of line items gets reduced to the number of regions i.e. 5


I hope this could be helpful for Level Based Measeure (LBM)

OBIEE Time Series AGO AND TODAE FUNCTIONS

Time series functions provide the ability to compare business performance with previous time periods, allowing you to analyze data that spans multiple time periods. For example, time series functions enable comparisons between current sales and sales a year ago, a month agoand so on.
  • You may only enter AGO and TODATE functions in the Expression Builder in the  Adminisration Tool.
  • You cannot use them in coded SQL.
  • Functions are for relational data sources only
The Ago and ToDate functions allow you use Expression Builder  to call a logical function to perform time series calculations instead of aliasing physical tables and modeling logically.
The time series functions calculate Period Ago and Period to Date functions based on user supplied calendar tables, not on standard SQL date manipulation functions
The TODATE function accumulates the measure from the beginning of the time series grain period to the current displayed query grain period.
ToDate aggregates a measure attribute from the beginning of a specified time period to the currently displayed time. For example, this function can calculate Year to Date sales.
If unsupported metrics are requested, NULL values will be returned and a warning entry will be written to the  file NQ.Querylog file when the logginlevel equals three or above.
ToDate function may not be nested within another ToDate function.
You can nest exactly one ToDate and multiple Ago functions if they each have the same level argument.

Syntax:
TODATE(<measure_expression>, <level>) 

OBIEE Best Practices of 3 Layers..

Physical Layer..
1. Import only need tables from Database. 
Import Tables

Reasons to do that :Its easier to import the table then creating it manually.In that way we are avoiding the table name , column name , data type mis match possibility. Import only those tables which you need. If you need more tables at later stage in project, you can always import them.
You will be using connection pool to import the table and that helps to make sure that connectivity to source database system is working fine.

Create Alias table.
Physical Layer Alias Table

We are creating alias tables for avoiding Circular JOINS.
It helps when we have confirm dimension(e.f time dimension) and we want to join dimension different way
Its easier to give the access of objects to users in case of Multi User Development Environment
Alias naming convention helps in easily finding the fact and dimension table in physical layer
We can import the key relationship in physical layer from database and maintain the relationship which is required among the alias tables

3. Se the Cache Property.
Cache Property of the tables

Its better to set the caching at physical table level and not at the alias table level.This applies to most of the scenarios
It your data source is OLTP system make sure you disable to caching. As  that changing frequency would be high and you do not want to cache results.
For all the data warehouse sources have better cache persistence time set

Connection Pool and its properties

COnnection Pool Property

Call interface: Use native call interface for the connection(e.g OCI10g) etc based on source database. Its faster then generic ODBC connection.
set connection pool , time out ,maximum connections etc based on server configurations and usage
connection pooling- it avoids the database connection overhead. If users run the same query it users the same connection from the pool. What does this mean is user sessions share the connection in this.
Maximum Connection :
Max what it should be :Approx 1024 kb of server memory is consumed in each connection.So tThis has to be set per server configuration and requirement.
Min what it should be: 25% of max users times the reports they execute.
e.g if you have 1000 users accessing around 10 reports  in dashboard that this number should 250 ( 25% of 1000) * 10 = 2500

BMM Layer:
Principle 1. Use Multi User Development Environment
Use the Multi- User Development  facility if there are multiple developers. Multiple developers to connect “online” to the same repository file and making changes is not recommended.
Multi User Development allows user to define a series of projects within the repository file ,where each project is a subset of the entire repository .If developers want to make changes , they can check out a project to a local machine make and test the changes,and then check the modifications back into the master repository file.
Principle 2.  Always run Global Consistency Check before releasing a repository.
Whenever we make changes to a repository ,always be sure to run Global consistency check. It is bad practice to release a repository that still contains consistency check errors. In some cases, consistency errors prevent Oracle BI Server from loading the repository. Use the Consistency check manager to identify and debug check messages.
Principle 3.  Separate Business Model
Even if you have only a single data source or schema in the physical layer, or you have only one physical data source for the repository, it is still good practice to break out the physical objects into multiple business models in the BMM layer to represent the independent areas of functionality.
Principle 4. Logical Tables
When building logical tables, do not merge multiple dimension tables into a single logical dimension table,and do not merge multiple fact tables into a single logical fact table.
Having multiple logical fact tables also makes it easier to create well defined projects for Multi User development.
It is also a good practice to prefix logical table names with either Dim-, Fact- ,or Fact Compound -.

This allows you to easily see how the tables are being used. It also groups the tables in the business model, so that facts are groups with facts, dimensions with dimensions  and so on.
Principle 5. Time Dimension
There are few things to keep in mind in time dimension factor.
  • Always must ensure that time Dimension hierarchy is built correctly and the logical level of each time- logical table source is set correctly
  • If there are multiple time dimensions within the business model, for consistency, make sure that all time dimension logical table contains the same columns and general structure. This is good for reporting purpose.
Principle 6. Logical Fact & Dimension table columns
  • Always assign a primary key for logical dimension tables. All logical dimension columns should be renamed in a way that is meaningful to users.
  • Bring only required columns in to the BMM layer for reporting.
  • Do not assign logical primary key for logical fact tables.
  • Create meaningful name for measures
  • Set aggregation rule for every logical fact columns.
  • Create “dummy” measures to group facts.
Principle 7. Logical Joins
Use only logical(complex ) joins in BMM layer. And always accept default properties when creating joins.
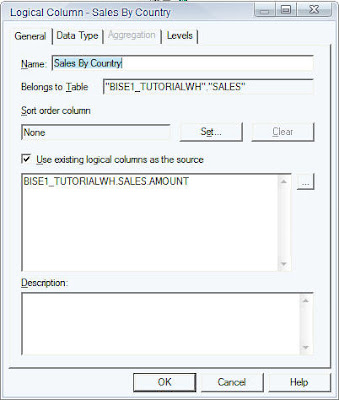
Principle 8. Calculated Measure
Be very careful when building calculated measures.
  • Use logical columns for calculations that require an aggregation rule that is applied before the calculation.
  • Use physical columns for calculations that require an aggregation rule to be applied after the calculation.
Principle 9. Aggregates
Few important things to keep in mind about Aggregates.
  • Try to ensure that each aggregate table has an effective summary ration with underlying detail.
  • Ensure that the logical level of every aggregate logical table source is set correctly.
  • Always test to ensure that aggregates tables are being used as expected.
  • If an aggregates is not used ,try changing the number of elements on one of the related logical dimension levels.
Principle 10. Dimension Hierarchies
In Dimension Hierarchies few things  are very important to keep in mind
  • It is best practice to create dimensional hierarchy for every logical dimension table in BMM layer.
  • All Dimension must have at least two levels : the total level and detail level.
  • If you are creating Dimensional Hierarchy manually, be sure to check Grand total level for the Total Level.
  • Use Update Row Counts or Estimate Levels to set the number of elements for every level of every Dimension Hierarchy.
  • Think about the experience of user when enabling drill down.
Principle 11. Avoid Snowflake schema
When there is Snowflaking in physical model,We should try to avoid Snowflaking in BMM layer and build models that use only star schema .
Use WHERE clause filters to help avoid using opaque views or complex joins in the physical layer.


Presentation Layer:
Principle 1.Subject Areas
Do not include all presentation layer objects in a single subject area (Presentation Catalog). While it is possible but still not recommended approach.


Principle 2. Development with End Users in Mind
Always develop the presentation layer so that end users are able to understand and use it.
Principle 3. Role Based Subject Area.
It is always good idea to create presentation catalog to suit the needs of individual users or user types. For ex. create a separate presentation catalog for sales managers because they need to see only an overview of an organization.
Principle 4. Presentation Tables
Presentation Tables should consistent across presentation catalog.
  • List Dimension tables first.
  • Do not mix dimension and fact columns in the same table.
  • Apply consistent ordering and naming conventions for tables and columns across catalogs.
  • Include the words “measure” or “fact” in the names of the fact presentation tables.
Principle 5. Rule of Seven
Keep presentation catalogs small and easy to understand by limiting the number of tables to seven.
Keep Presentation catalogs small and easy to understand by limiting the number of columns to seven.


Principle 6. Fact Tables
Try to limit the presentation catalogs so that there are no more than a couple of fact presentation tables in each catalog. It is important to avoid situation in which there are multiple join paths existing within one presentation catalog.
Principle 7. Implicit Fact Columns
If you have multiple fact presentation tables, it is always best practice to assign an implicit fact column. Implicit facts come into play when an Answers report contains columns from more than one logical dimension table and no explicit facts.
Principle 8. Canonical Time
Canonical time is a useful way for allowing users to report for a specific period of time across multiple star schema. If you use canonical time ,make sure that the corresponding time presentation table is given a very generic  name and that name is consistent across all the presentation catalogs.
It should be the first table in a catalog.
Principle 9. Secondary Time Dimension
This function enables users to build time reports for specific star schema.
Secondary time dimensions can be given their own presentation tables further down the list.We can place all secondary time dimension objects into a single presentation table.
Principle 10. Nesting Presentation Table
Prefix presentation table names with a hyphen to group common objects together into sub folders.
Principle 11. Presentation Object Names & Description
  • Use the Alisa tab to keep track of prior names.
  • Use the default option that synchronize the presentation column name with the underlying logical column name.
  • Use only logical, business -oriented names ( rather than physical object names) in the presentation Layer.